Axis labels, titles, and legends. Number formats. Background color and fonts
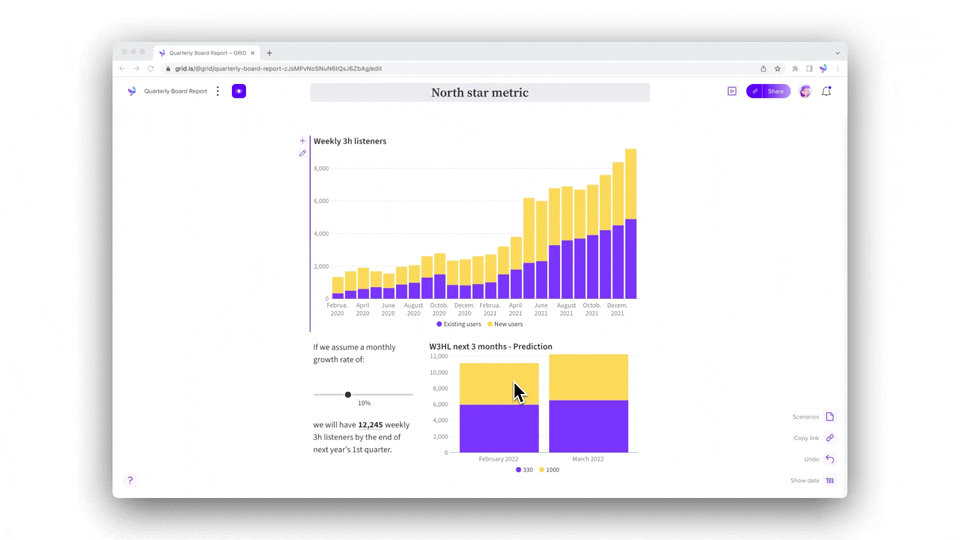
Everyone can change chart colors. By default, all charts you create will use GRID's default color palette, GRID Tropical. You can easily change the colors in your chart by choosing a new palette from the list, or by creating your own customized palette.
You can select from a range of beautiful palettes using the dropdown in the Color palette option under the Customize tab in the Editor panel.

https://grid.is/embed/colors-in-charts-kmIf3kYOQauXDkHKeUWfng?p=o9QXkezZJO
To build your own palette, you can use the color picker to create a custom set of color tiles, or type in an RGB, HSL or HEX web color codes if you need a brand-specific color. If you're new to web colors, you can find a lot of good color pickers and palette generators online.
As with every option in GRID, colors can also be set either by clicking the fx
button and typing in constant values (for example ={"red","blue","#CCC"}
), typing in a formula, or referring to cells in the spreadsheet.
