You can connect a GRID document to your Notion databases. Then you can visualize it in a chart.
How to create charts from your Notion database
https://www.youtube.com/watch?v=gSH3hhra5VY&ab_channel=GRID
Connecting the database
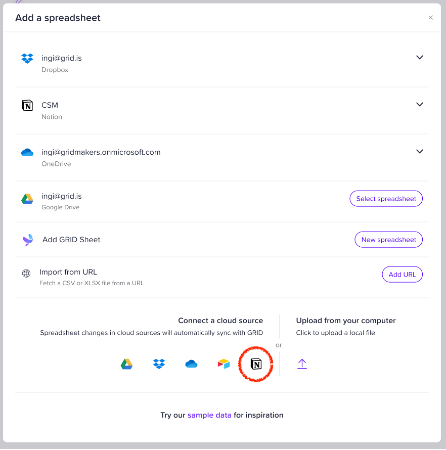
- When you create a new GRID document you’re offered to Add existing data, like your Notion database.

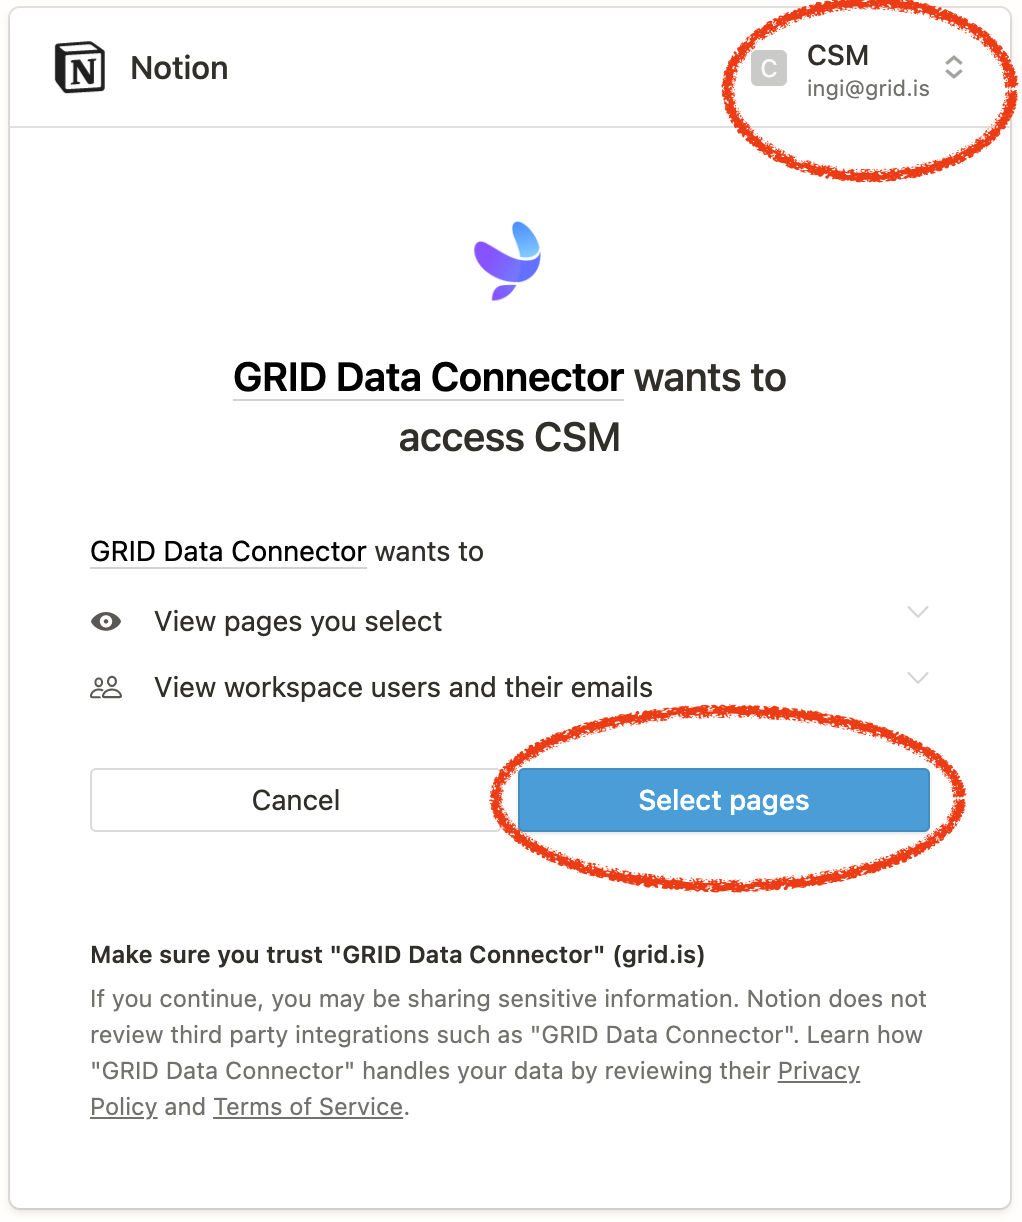
- Select Notion and follow the steps to authorize GRID to access the database. Then select your workspace and authorize GRID access to it.
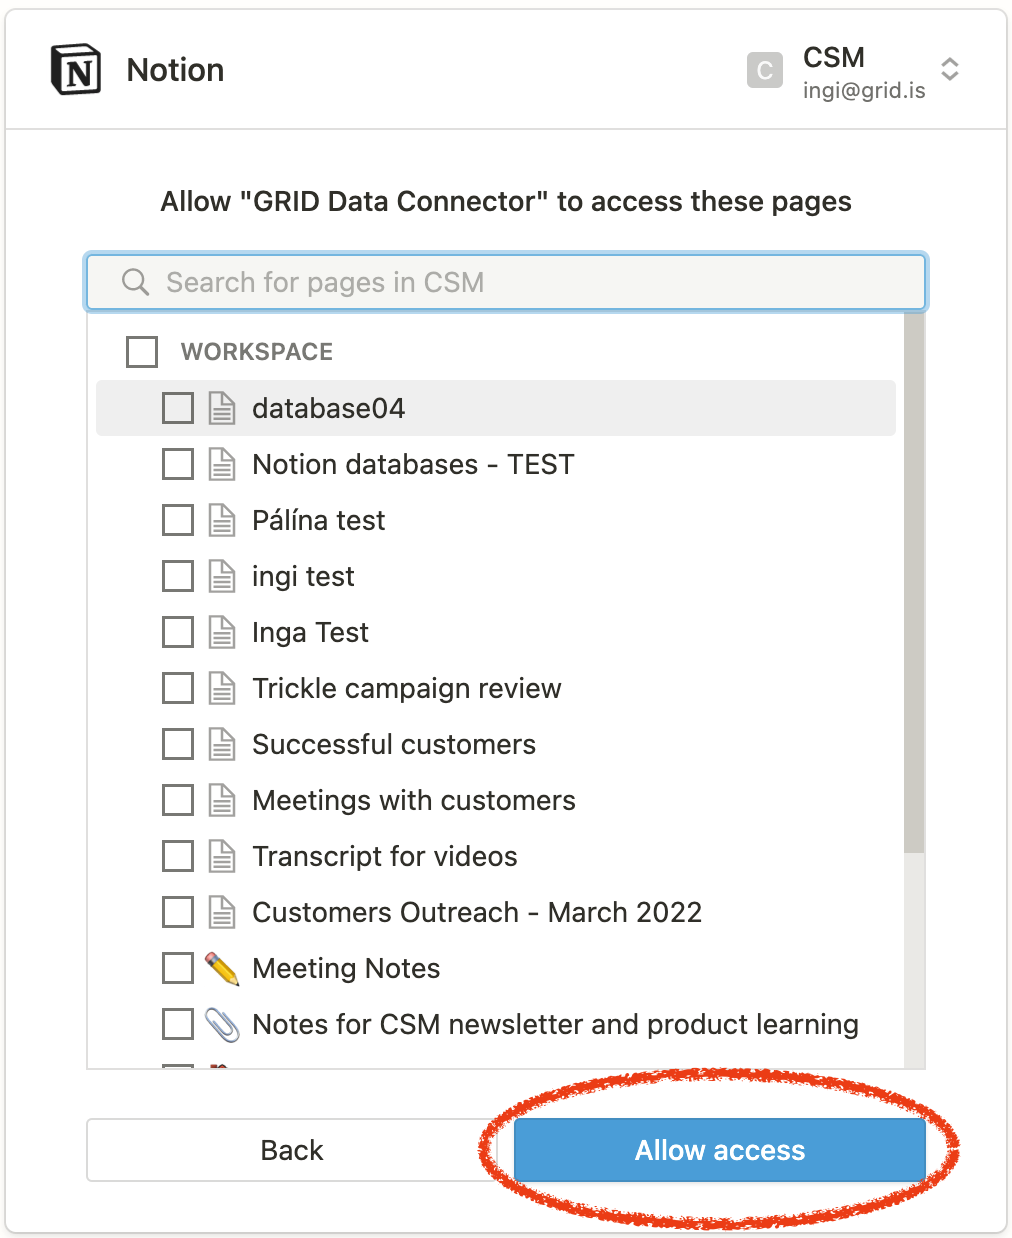
- Select which pages you want GRID to access.
- Now you've established a cloud connection between GRID and Notion.
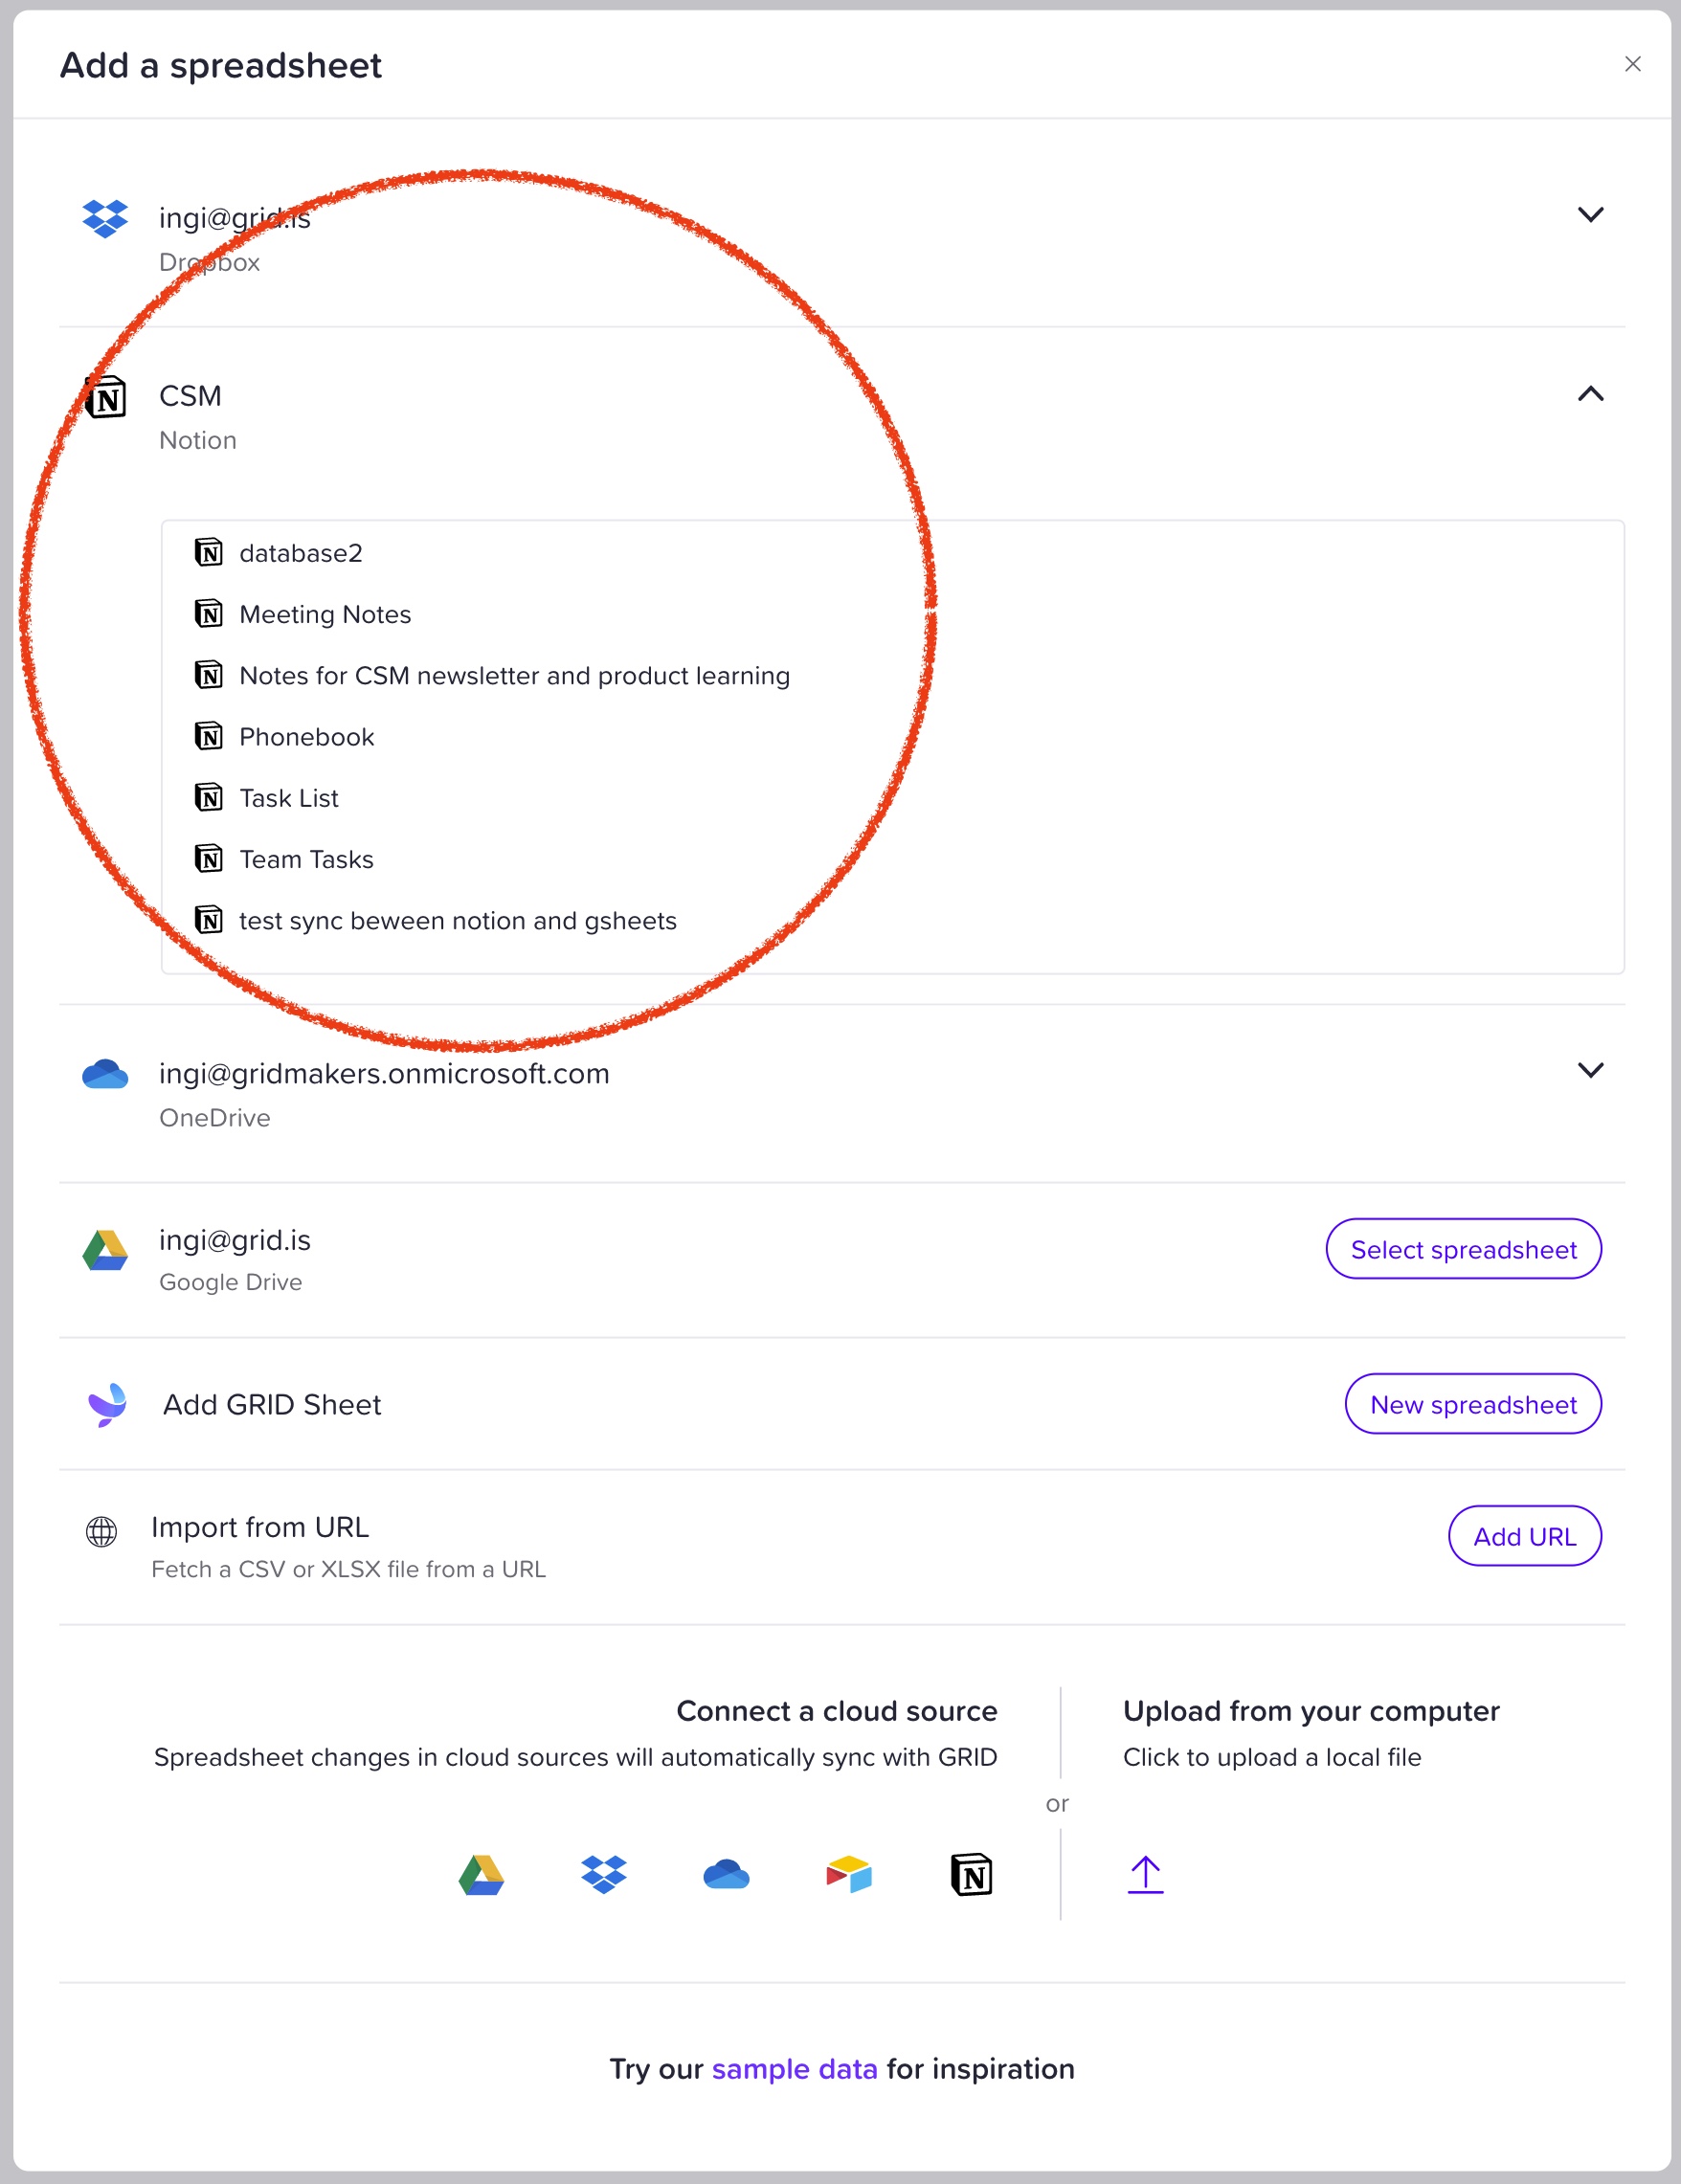
- Choose the database you want to connect to your GRID document and start adding charts and other elements to visualize your data instantly.