We aim to give everyone the power of a data analyst. You can make advanced charts and summarize your data in GRID if you’re willing to write just a little bit of spreadsheet formulas. Don’t worry, though. We developed an AI assistant that allows you to generate formulas from natural language.
<aside> 💡 Check out this guide on building a burndown chart in GRID.
</aside>
https://www.youtube.com/watch?v=UIfAnEvDCdo
Here you can see further information about how to use the formula assistant!
To make your data visualizations look like they were done by a professional you sometimes need to prepare the data a bit.
You can do this preparation in GRID Sheets which is our built-in spreadsheet editor. If you're familiar with the capabilities of other spreadsheet editors like Excel or Google Sheets, you can do most of the same things in here.
Here are a few tricks that can be useful.
When writing formulas in a spreadsheet you can reference a spreadsheet cell with something like A1 or a range of cells with something like A1:C10, A:C, or A2:C.
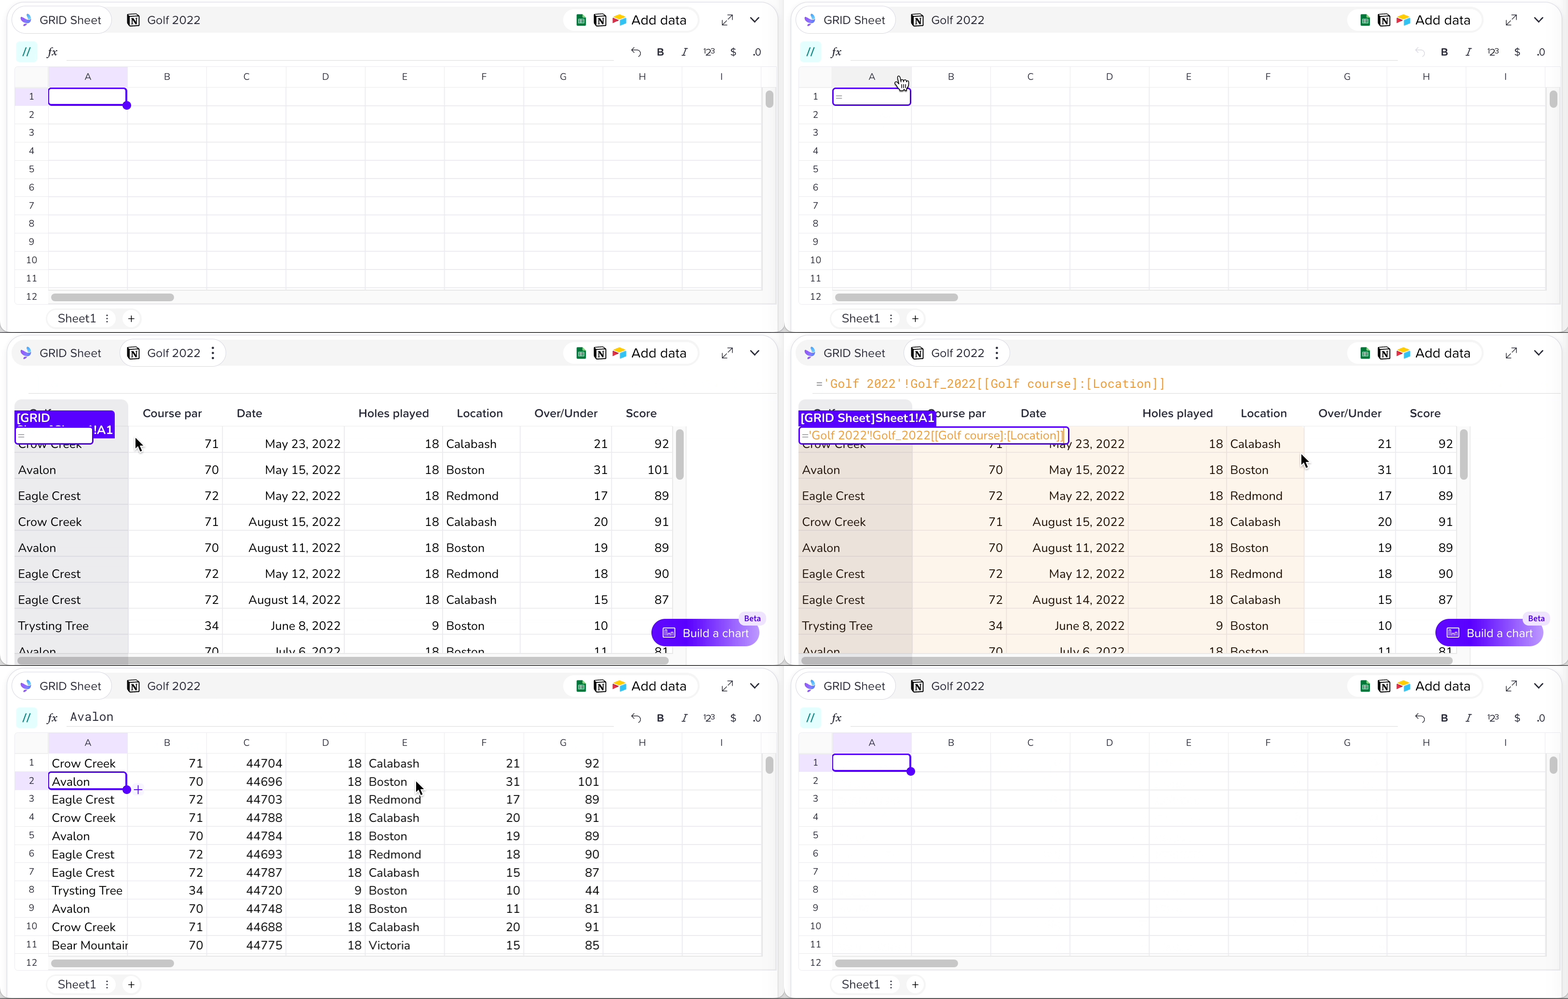
Notion data is not a spreadsheet so we reference the data differently. The simplest way to reference it is using the mouse. Just write the equal sign in a cell and then point to the data you want to reference.
The references will look like this:
='Golf 2022'!Golf_2022='Golf 2022'!Golf_2022[Golf course]='Golf 2022'!Golf_2022[[#Headers],[Golf course]:[Course par]]='Golf 2022'!Golf_2022[[#Headers],[Golf course]]
Currently, the columns in a Notion database appear in GRID in alphabetical order, except for the first column which stays number one. The simplest way to reorder the columns is to use the CHOOSECOLS function.